The classes will be in MCS1007, the new Maths and Science Building in Upper Mountjoy1.
Practical session every Friday (11 - 13.30)
17th February - Intro to R and R-Spatial
24th February - Vector based analysis
3rd March - Raster based analysis
10th March - Vector Raster interaction
Format
# focus on learnig by doingasar <- class_material %>%# I will prepare material for each classlive_coding() %>%# as in Data Carpentriesfeedback() %>%# ask questions - I will take notesupdate() %>%# I will update material and add resourcesshare() # I will share it as html, pdf
although some additional resources are included (e.g.Intro to R)
Assesment
# practicalassesment <- class_material %>%# you will re-use your materialdata() %>%# I will share new data with youanalysis() %>%# you will read, wrangle, analyse and visualize datareport(500) %>%# You will write a short report # scorescore <- assesment %>%reproducibility() %>%# the analysis should be reproduciblefolder_structure() %>%style() %>%# variables names, use of space tabsnarrative() %>%# e.g., clear comments explaining code and workflowanalysis() %>%# accuracy - code should work as intendedreport() # explanation of deployed method, clear figures formatting
The summative deadline for project delivery will be 12pm, Monday 24th April 2023, via Turnitin.
Archaeological Spatial Analysis
“The main aim of this work is to suggest to archaeologists that there is a potential for more detailed and systematic study of spatial patterning in archaeological data.”
(Hodder and Orton, 1976, p1.)
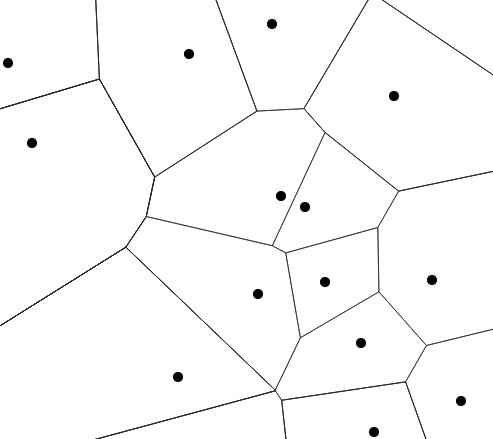
Spatial Analysis1
Spatial data manipulation - usually in GIS
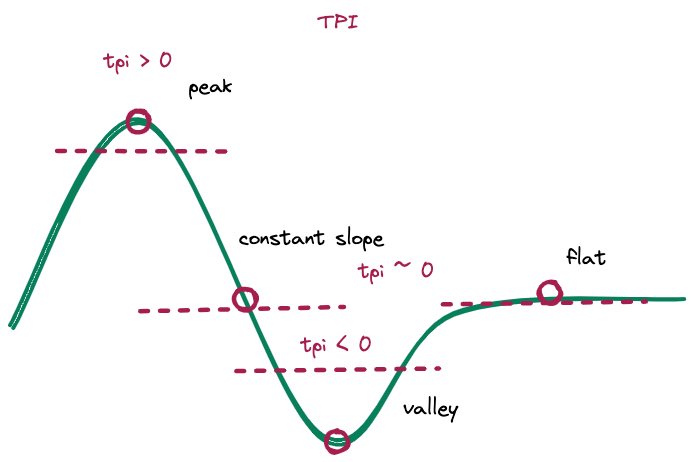
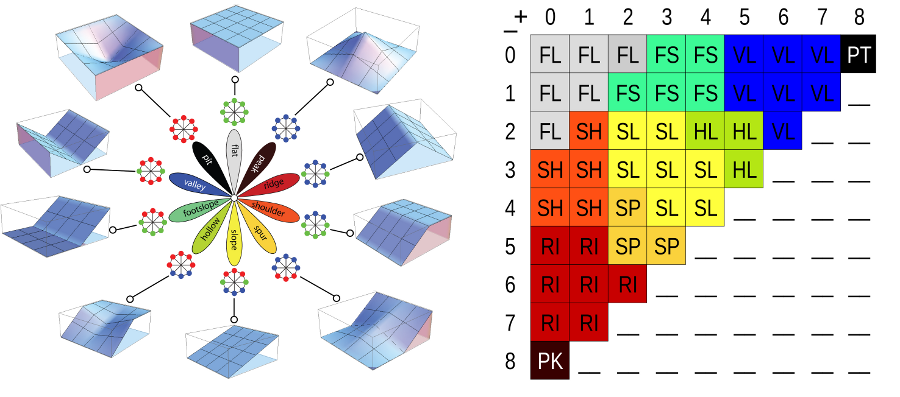
Spatial data analysis - descriptive and exploratory
Spatial modelling - construct models to predict outcomes
Why R? .Global_Env
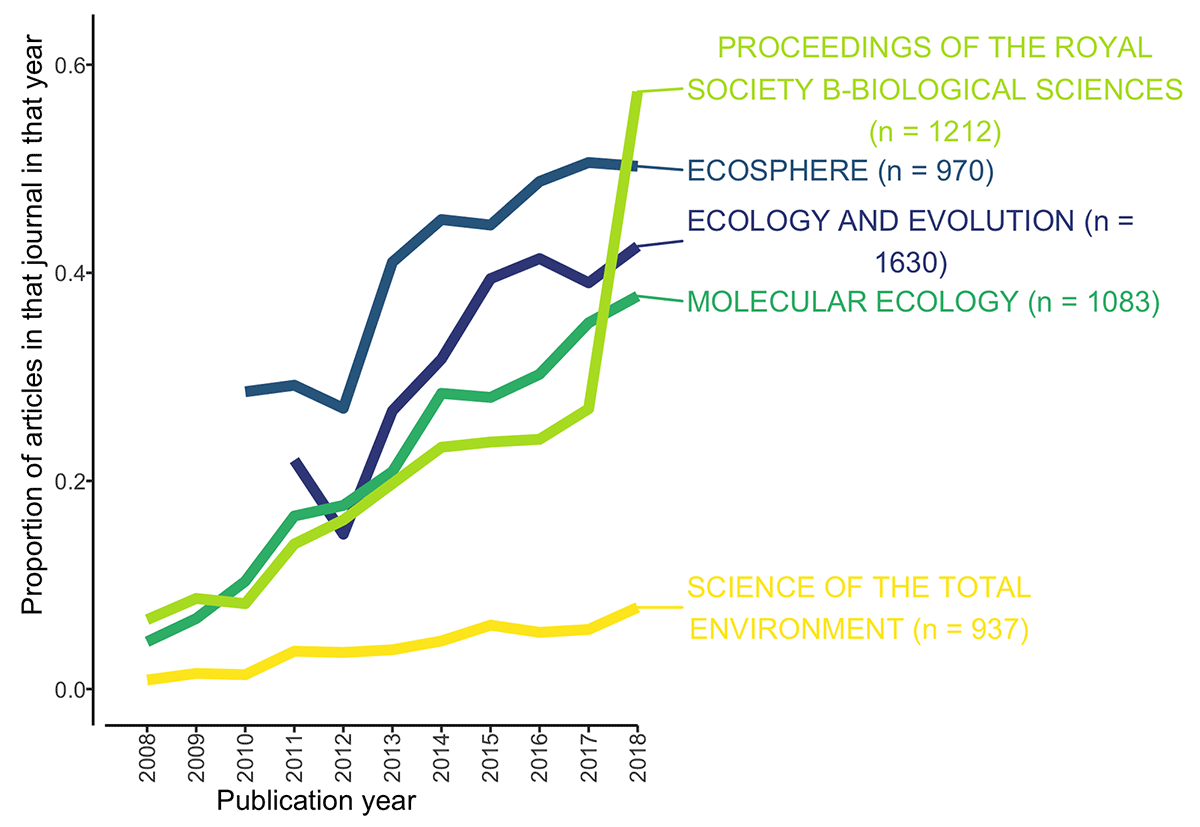
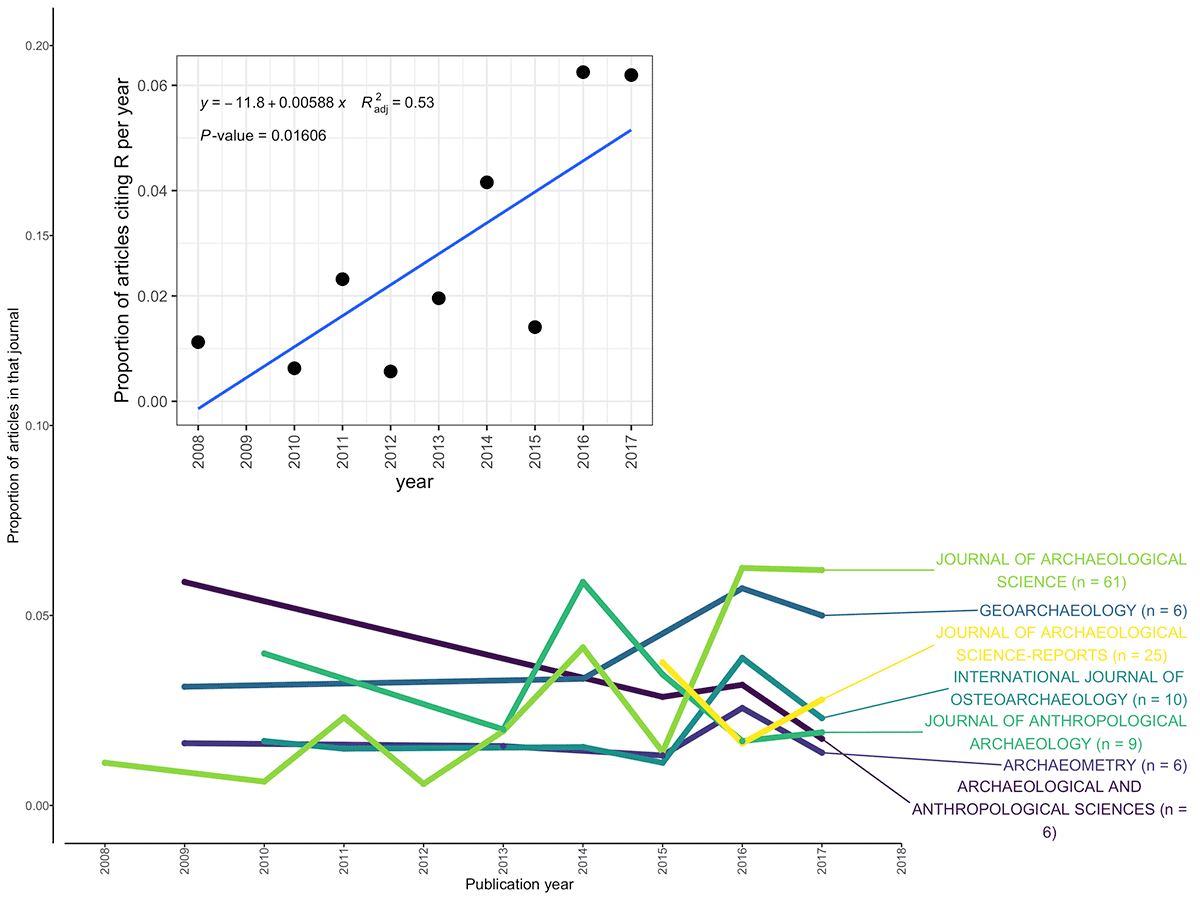
Tool - Driven Revolution in Archaeological Science 1
Schmidt and Marwick, Fig 1 and 2.
Why R? .Global_Env
Tool - Driven Revolution in Archaeological Science 1
ecology has moved much earlier to open programming such as R
archaeology have yet to adapt programming
we should update training curricula
emerging researcher in archaeology should be proficient in programming / analysis to collaborate with other domains (but not necessarily an expert in computer science)
Why R? .Local_Env
It is a great resource for data analysis, data visualization, data science and machine learning
It provides many statistical techniques
It is easy to draw graphs in R, histograms, box plot etc..
It works on different platforms (Windows, Mac, Linux)
Lovelace R, Nowosad K, Muenchow J, Geocomputation with R, Chapter 6 - link
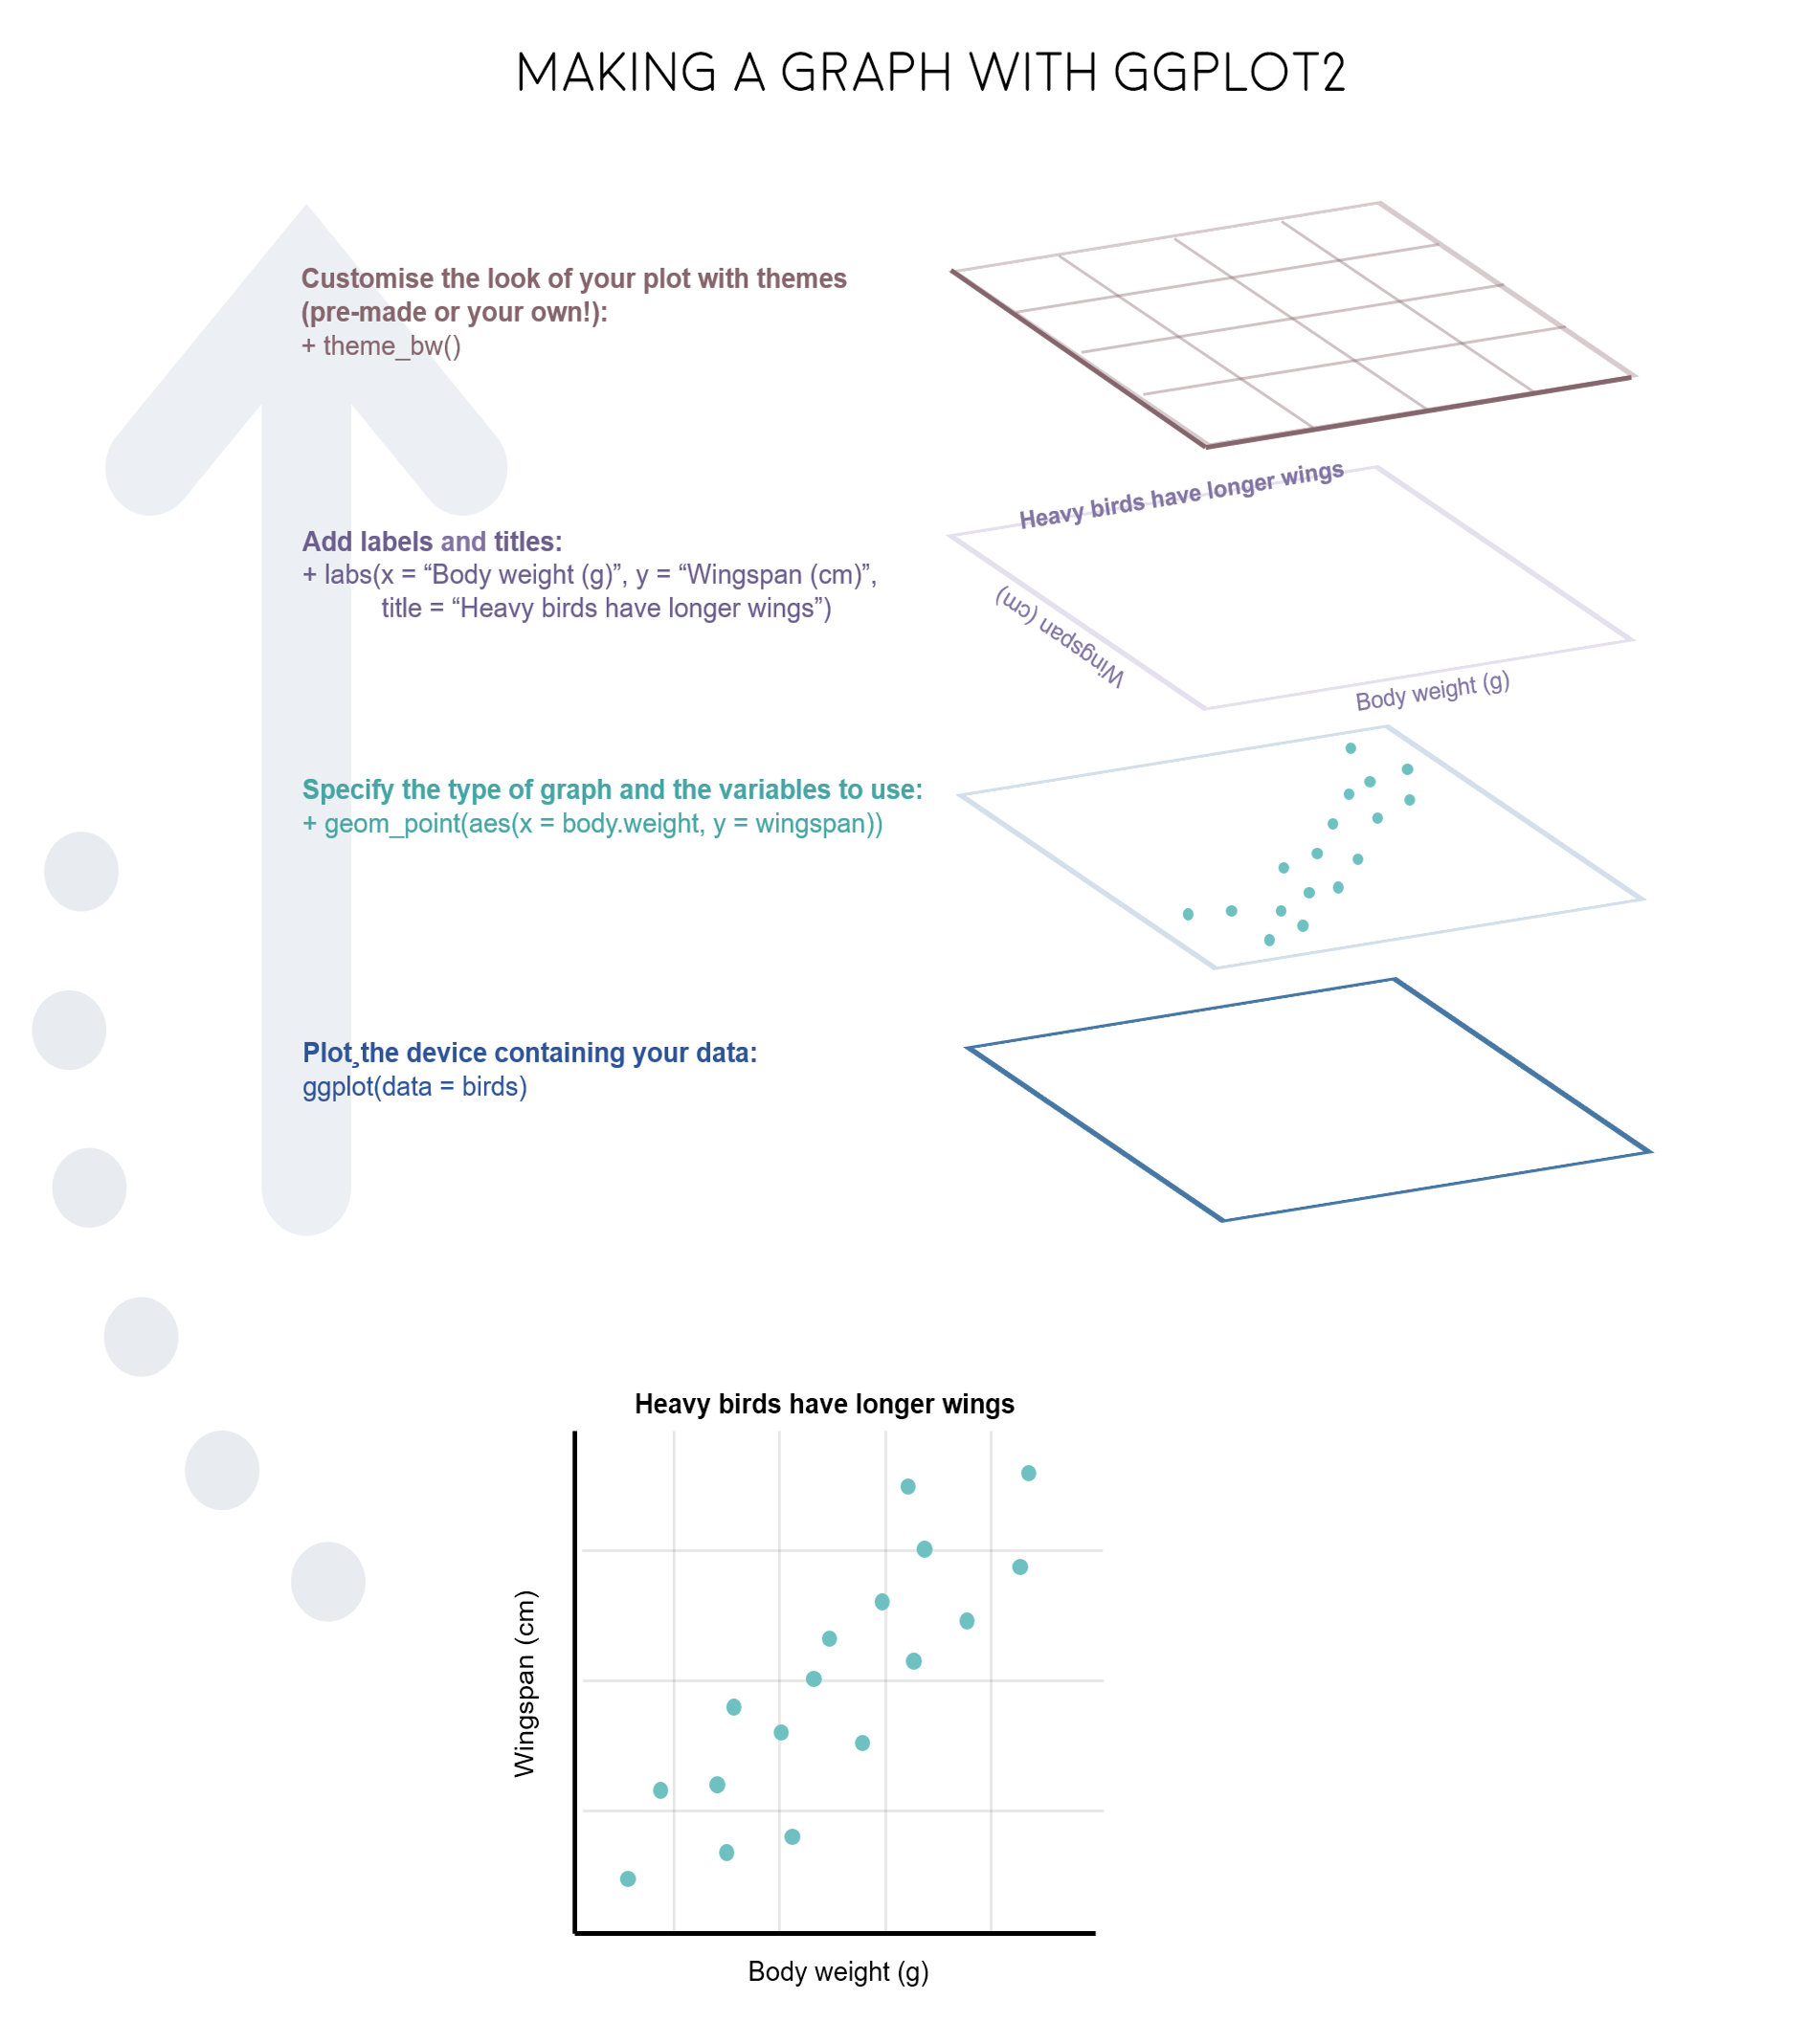
Grammar of Graphics
Literate Programming
‘By coining the phrase “literate programming”, I am imposing a moral commitment on everyone who hears the term; surely nobody wants to admit writing an illiterate program’